
U.S. Hazelnut Export Market Update: Trade Trends, Key Markets, and Outlook
Executive Summary
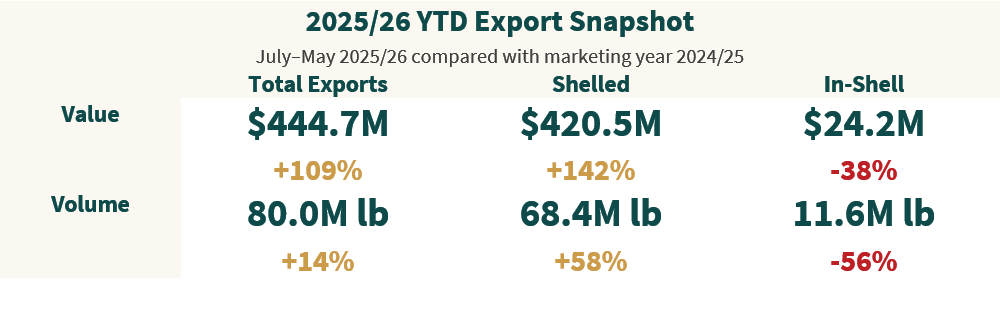
U.S. hazelnut exports set records in both volume and value through July–May 2025/26, with 2025/26 YTD export volume reaching roughly 80.0 million pounds, exceeding the marketing year 2024/25 total of 70.0 million pounds. Total export value reached approximately $444.7 million versus marketing year 2024/25’s value of $212.8 million. The current export environment should be viewed in the context of a disrupted global hazelnut market. Turkey, which typically accounts for the majority of global hazelnut supply, experienced significant 2025/26 crop pressure from frost, weather stress, and quality concerns. That shortfall tightened global availability, lifted pricing, and created a wider opening for U.S. hazelnuts in markets that may have otherwise remained more heavily supplied by Turkish origin product
Overall Update
The overall U.S. hazelnut export market is stronger in value, moderately higher in volume, and more concentrated in shelled product than in prior years.
Value growth is outpacing volume growth: 2025/26 YTD export value is 109% above marketing year 2024/25, while total pounds are 14% above marketing year 2024/25.
Shelled product defines the export profile: Shelled hazelnuts accounted for approximately $420.5 million of the $444.7 million total and represented about 95% of export value.
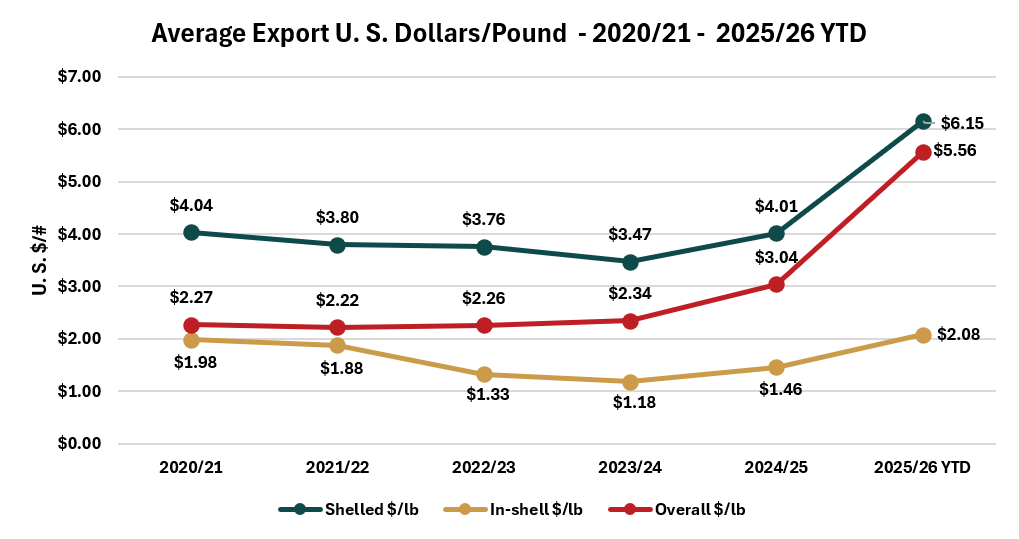
Pricing has moved upward: Overall average export value rose to $5.56/lb, compared with $3.04/lb for marketing year 2024/25.
Canada remains the largest destination: Canada accounted for approximately $201.1 million in total export value and 33.4 million pounds, making it the dominant market by both value and volume. This accounts for 45% of the 2025/26 YTD exports by value and 42% by volume.
Growth is concentrated but not isolated: Italy, Germany, and Mexico are meaningful contributors to the export increases versus marketing year 2024/25, while smaller markets such as Belgium-Luxembourg, Australia, and Brazil may represent additional demand-building opportunities.
Overall, the market appears to be moving toward a more value-added export model. The near-term opportunity is to use the current pricing environment to strengthen buyer relationships, validate demand in emerging markets, and reduce dependence on in-shell channels.
Average US Hazelnut Value per lb by Year
Five-Year Historical Trend
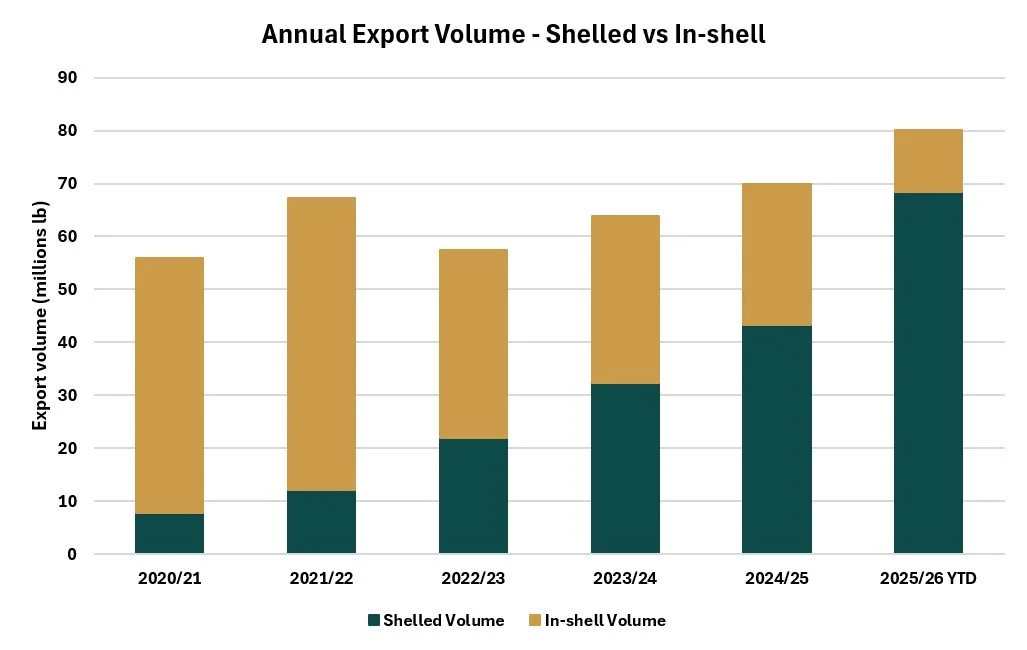
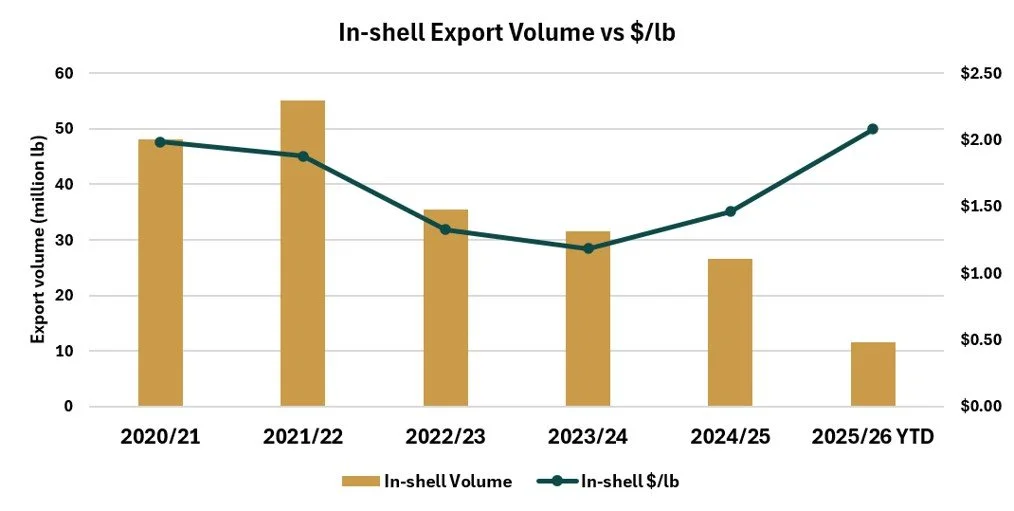
The five-year trend shows a structural change in U.S. hazelnut exports with importers moving away from in-shell product and gravitating to more shelled product. In 2020/21 and 2021/22, in-shell hazelnuts represented approximately 86% and 82% of total export volume, respectively. By 2022/23, shelled exports had overtaken in-shell exports, and by 2025/26 YTD, shelled product has become the dominant export.
• Shelled export value increased consistently: Shelled value rose from $31.5 million in 2020/21 to $173.8 million in 2024/25, and reached to $420.5 million in 2025/26 YTD.
• In-shell value weakened after 2021/22: In-shell exports peaked at $103.5 million in 2021/22, fell to $47.1 million in 2022/23, and reached $24.2 million in 2025/26 YTD.
• Total value stepped above the historical range: Total export values moved between approximately $126.8 million and $212.8 million from 2020/21 through 2024/25, then reached $444.7 million in 2025/26 YTD.
• Price per pound: Overall average export value rose from $2.27/lb in 2020/21 and $3.04/lb in 2024/25 to $5.56/lb in 2025/26 YTD.
Much like Pistachios, the historical pattern suggests the U.S. hazelnut export market is becoming less dependent on bulk in-shell channels and replacing it with increased processed kernel demand, destination-specific specifications, and higher-value customer relationships.
Shelled Update
Shelled hazelnuts are the clear driver of current U.S. export performance. Through July–May 2025/26, shelled export value reached approximately $420.5 million, already 142% above marketing year 2024/25. Volume reached approximately 68.4 million pounds, 58% above the marketing year 2024/25 total.
The shelled category points to a stronger value-added export model. The opportunity is not just higher shipments, but capturing a higher percentage of the value chain as well as more durable demand from buyers that require consistent quality specifications, documentation, and reliable supply.
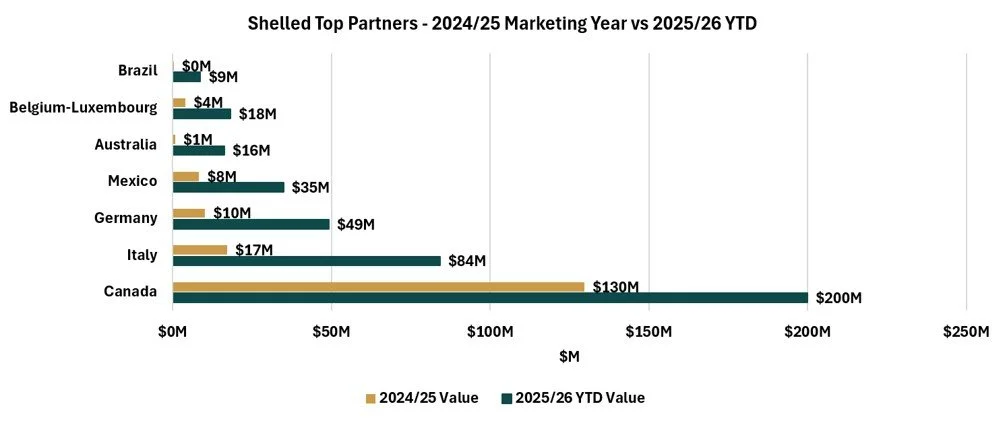
Canada is the largest shelled destination: Canada accounted for approximately $199.9 million in shelled value and 33.1 million pounds.
Shelled pricing improved materially: Average shelled export value rose to approximately $6.15/lb, compared with $4.01/lb for marketing year 2024/25.
Italy, Germany, and Mexico are major growth markets: Italy reached approximately $84.1 million, Germany $49.1 million, and Mexico $34.9 million in shelled export value.
Smaller markets are gaining relevance: Belgium-Luxembourg, Australia, and Brazil contributed to the broadened shelled export base, accounting for 10% of the 2025/26 YTD export value, up from 3% of the 2024/25 export value.
In-Shell Update
In-shell hazelnut exports continue to soften. July–May 2025/26 in-shell export value totaled approximately $24.2 million, 38% below marketing year 2024/25, while volume declined 56% to roughly 11.6 million pounds versus the marketing year 2024/25 total of 26.6 million pounds. In-shell average price per pound increased to approximately $2.08/lb, compared with $1.46/lb for marketing year 2024/25.
Hong Kong remains the largest in-shell value destination: 2025/26 YTD exports to Hong Kong totaled approximately $7.3 million, although value and volume are both below marketing year 2024/25 levels.
Italy was the key positive outlier: In-shell exports to Italy increased to approximately $6.6 million and 3.3 million pounds. Early 2026 crop reports indicate that high temperatures during critical nut set may lead to a reduced or poor-quality crop year in Italy.
Exports to China continues to materially weaken: China declined from $8.3 million in 2024/25 and $24.5 million in 2020/21, to just $2.8 million in 2025/26 YTD.
Conclusion
The key question for US producers is whether this improved market position will endure if Turkey’s production rebounds. Pricing may soften if Turkish supply normalizes, especially if buyers return to established origin relationships or if lower-cost Turkish kernels become more available. At the same time, the U.S. export data contains an important demand signal: even with values at record levels, total volume has significantly surpassed previous years. Buyers are still taking more product, despite the higher cost environment.
The 2025/26 disruption may also have forced buyers to source product from alternative origins, broaden supplier relationships, and place more value on reliability and quality. For U.S. exporters, the opportunity is to convert what may have begun as global supply-shortfall driven demand into repeat business based on reliability, quality, specification performance, documentation, and service. According to the EU’s Comext data, the U. S. 2025/26 YTD market share of hazelnut imports by value is 12.2%, up from just 0.4% in 2020/21.
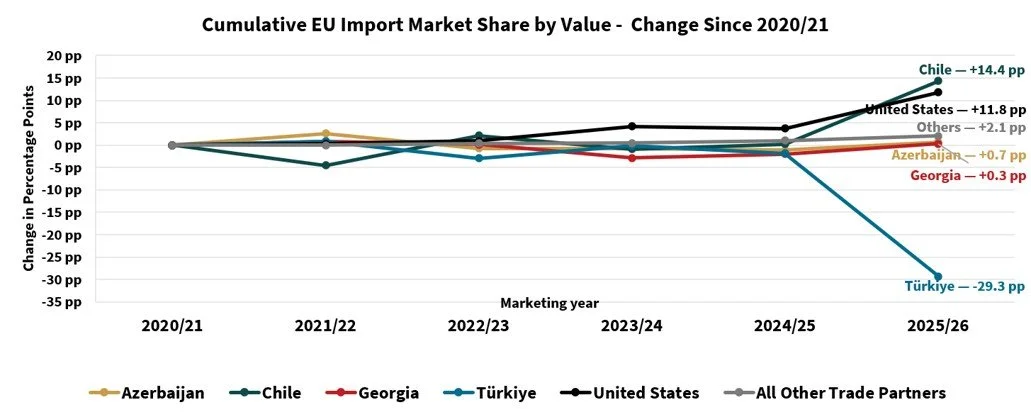
The strategic implication is that U.S. exporters are currently using or should use the current pricing environment to build durable, repeatable demand for processed kernels. Quality consistency, buyer specifications, traceability, documentation, and reliable supply are likely to matter as much as crop size. The strongest long-term outcome would be a market that retains today’s higher-value positioning even if global supply conditions normalize.
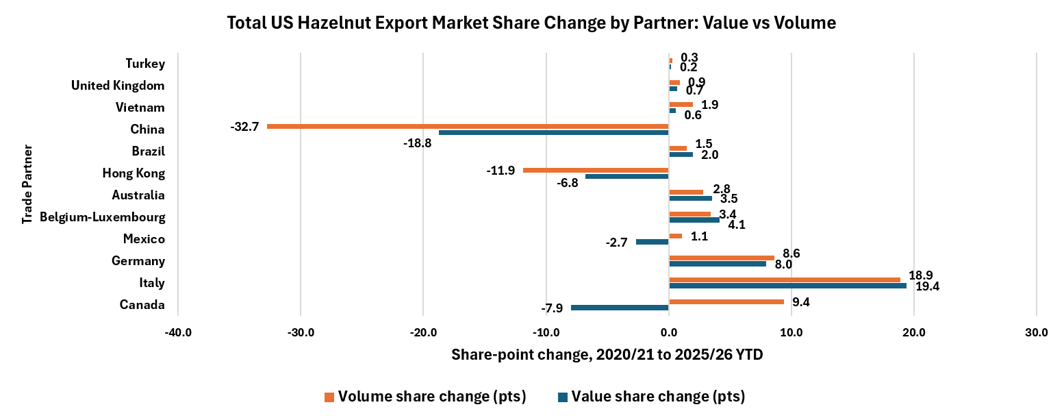
2020/21-2025/26 YTD export performance based on USDA FAS trade data, with values shown in U.S. dollars and volumes shown in pounds.