
NCREIF Q2 Farmland Values Update #2: Pacific Northwest, Mountain States, & California
In the second of two posts detailing second quarter farmland investment returns, we review figures for the Pacifc Northwest, Mountain States and California regions, includiing California permanent crops. The first post detailing regions in the eastern half the US can be found here.
PACIFIC NORTHWEST
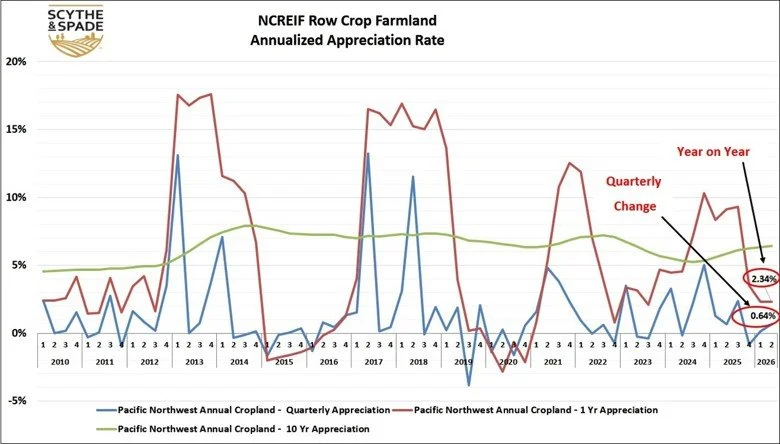
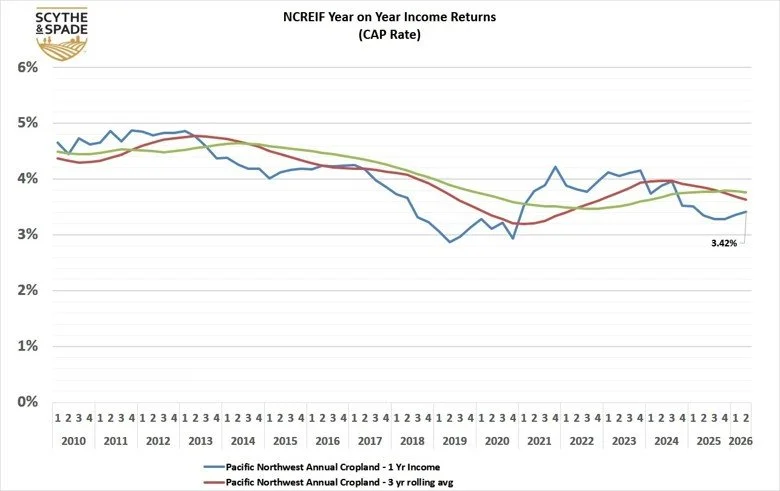
Pacific Northwest row crop farmland remained the strongest appreciating region in Q2 2026, with a year-over-year increase of +2.34% and quarter-over-quarter appreciation of +0.64%. The region also produced a year-over-year CAP rate of 3.42%, providing a comparatively balanced combination of appreciation and current income.
The region continues benefiting from crop diversity, export-oriented production systems, and comparatively constrained land supply. Q2 appreciation accelerated from the prior quarter, while the income return remained near the region's longer-term averages, indicating continued stability rather than a renewed broad-based value surge.
The Pacific Northwest remains one of the more differentiated farmland regions within institutional portfolios due to its unique crop mix and low correlation with other regions. As a result, it continues attracting interest from investors seeking diversification within agricultural real assets.
MOUNTAIN STATES
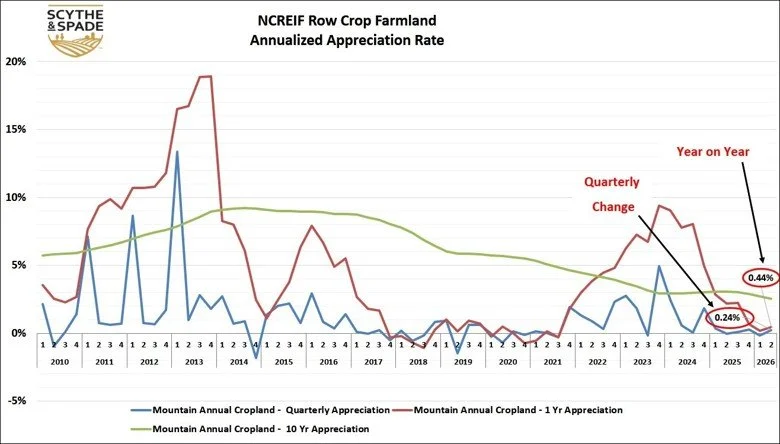
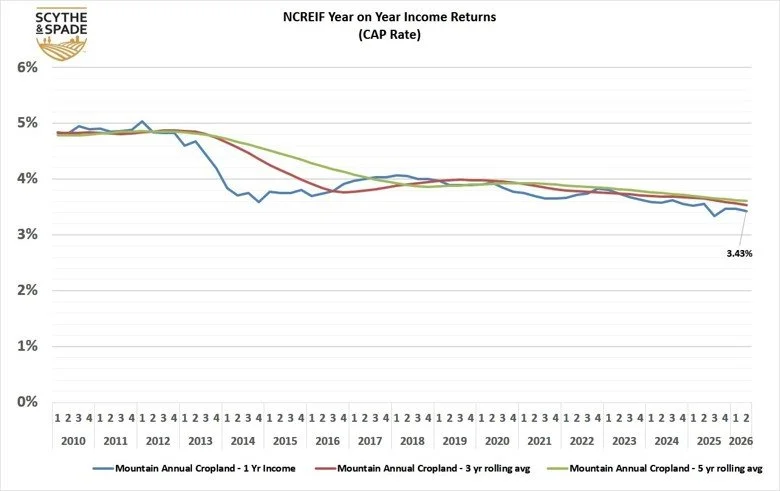
Mountain state row crop land values remained relatively stable in Q2 2026, posting a year-over-year increase of +0.44% and quarter-over-quarter appreciation of +0.24%. The region's year-over-year CAP Rate was 3.43%, one of the stronger current income returns among the regions included in the review.
The region continues lagging broader national farmland cycles by several quarters, consistent with prior periods. Lower transaction volume and thinner institutional participation can create slower valuation adjustments both during periods of appreciation and correction.
Operationally, the region continues facing many of the same pressures present nationally, including elevated financing costs and weaker producer margins. However, relatively lower land values, localized supply constraints, and a comparatively durable income return have thus far helped stabilize pricing.
Pacific West (CA) ROW CROPLAND
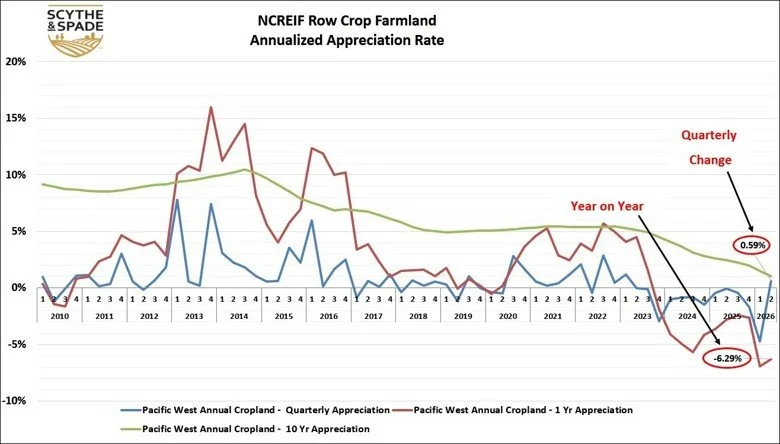
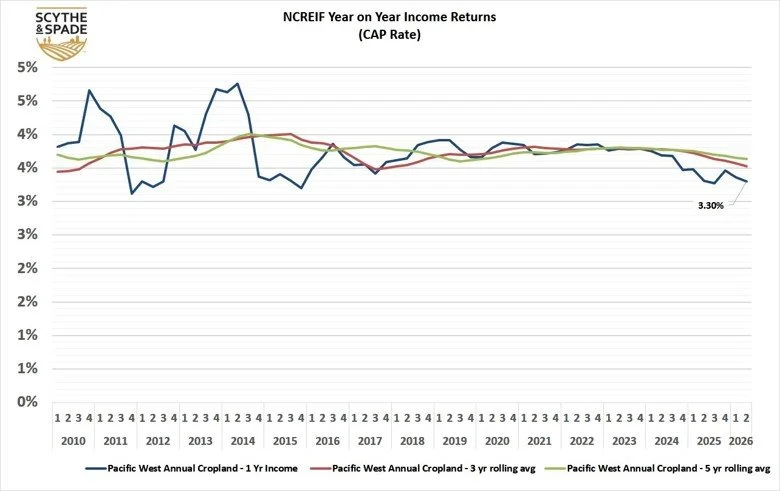
California row crop farmland showed a meaningful quarterly improvement in Q2 2026, appreciating +0.59% quarter over quarter after the sharp decline recorded in Q1. However, values remained down -6.29% year over year. The region's year-over-year CAP rate was 3.30%, providing positive current income despite continued annual value loss.
The broader trend continues reflecting a prolonged repricing process tied primarily to water availability and long-term sustainability concerns. Increasingly, institutional focus is shifting away from simply identifying productive acreage toward determining which specific water profiles, groundwater positions, and regulatory exposures remain investable over long-term holding periods.
The market also continues differentiating sharply between individual assets rather than treating California farmland as a uniform category. Water district positioning, groundwater sustainability exposure, permanent versus annual crop flexibility, and recharge potential are all becoming increasingly central drivers of valuation.
Although the positive quarterly appreciation rate suggests that the pace of repricing may be moderating, the significant year-over-year decline continues to warrant caution. Investors remain focused on long-term water allocation, income durability, and asset-specific operating risk.
Pacific West (CA) PERMANENT CROPLAND
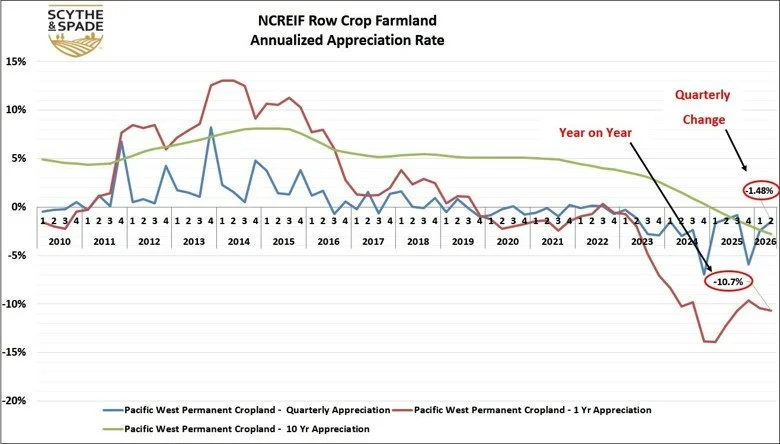
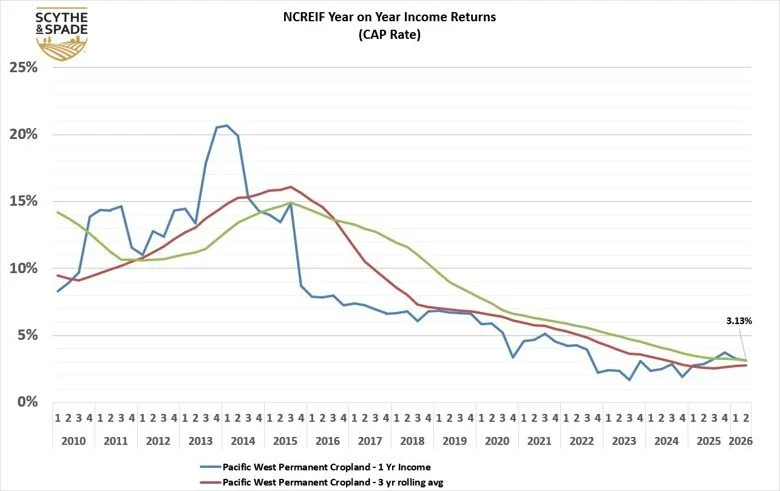
California permanent cropland remained the weakest segment within the broader NCREIF farmland portfolio in Q2 2026, posting a quarter-over-quarter value decline of -1.48% and a year-over-year decline of -10.70%. The quarterly decline moderated from Q1, but the annual rate of value loss remained severe. The year-over-year CAP rate was 3.13%.
The improved but still negative quarterly return may reflect gradual stabilization in selected assets, but permanent cropland continues facing uneven crop economics, elevated operating and development costs, and long-duration water uncertainty. Unlike annual row crop acreage, permanent plantings possess limited operational flexibility once established, amplifying valuation sensitivity during downturns.
Importantly, the longer-duration appreciation trend continues illustrating the magnitude and persistence of the correction that began in late 2019. The 10-year rolling appreciation average is now negative, while the current income return has improved relative to the lowest levels shown in the recent series.
Despite these pressures, transaction activity may be slowly returning for select high-quality assets with secure water positioning and sustainable orchard economics. The Q2 figures suggest that the market may be progressing through the later stages of repricing, although the year-over-year loss confirms that stabilization remains incomplete.
SUMMARY
NCREIF farmland returns continue providing a more granular and institutionally relevant perspective on agricultural real estate trends than USDA data alone. The broader US row crop portfolio strengthened modestly in Q2 2026, but regional divergence remained pronounced. The Pacific Northwest produced the strongest annual appreciation, while California row crop and permanent cropland continued recording substantial year-over-year losses.
The current environment increasingly rewards specialization, local operational knowledge, and careful underwriting rather than broad exposure alone. Water access, regulatory exposure, crop flexibility, regional operating economics, and the durability of income returns are becoming increasingly important determinants of long-term value stability.
Farmland continues maintaining many of the characteristics that have historically made it attractive to institutional investors, including inflation protection, low long-term correlation to traditional financial assets, and relatively durable underlying demand fundamentals. Across the regions shown, current year-over-year income returns ranged from 2.16% in the Corn Belt to 3.43% in the Mountain States, underscoring the importance of both appreciation and income when evaluating regional performance.
As the current correction progresses, debt delinquencies continue emerging across multiple farmland regions. For investors capable of underwriting operational, water, and geopolitical risks correctly, the present environment may continue creating selective opportunities to acquire quality agricultural assets at materially improved relative valuations.