
Are US Rowcrop Farmland Rents and CAP Rates Increasing Despite the Current Farm Economy??
It is widely held that current US farm level income is under stress. High fertilizer and diesel prices would seem to confirm this view. It was then very surprising to us when the recently released Q3 2026 NCREIF data showed an increase in both CAP rates and land values for US annual/rowcrop ground, which then impllies higher farm lease rates. Can this be true in the current tight crop margin environment?
Figure 1 below shows quarterly annual NCREIF CAP Rates for annual rowcrop through Q3 2026. Note the uptick in all major rowcrop regions except for the Northern and Southern Plains.
Figure #1
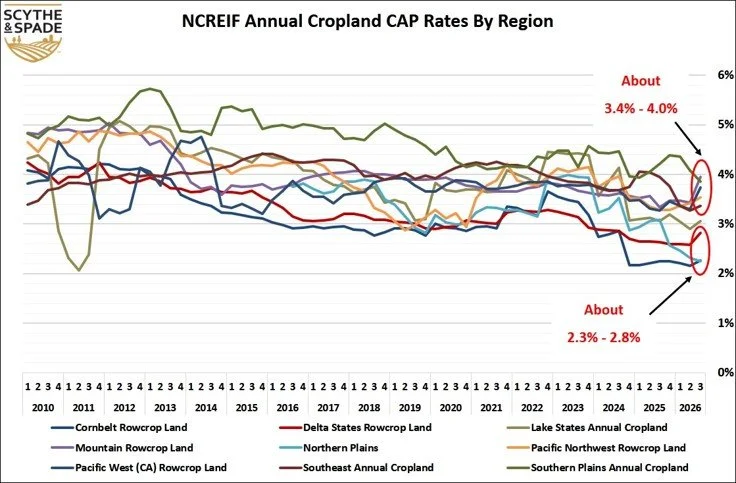
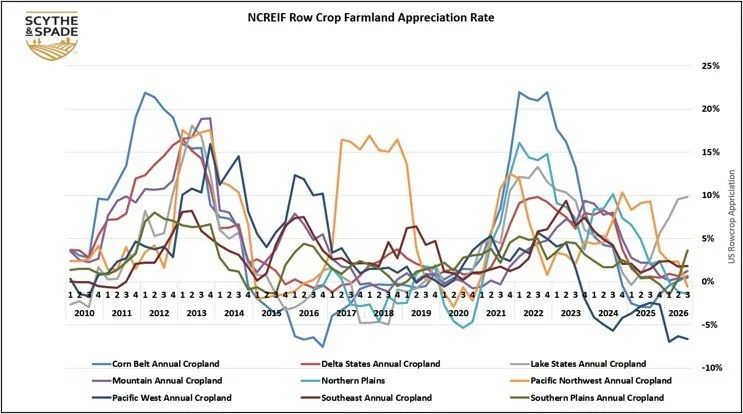
These increased CAP rates are in stark contrast with the still increasing rowcrop land values in most regions. All major rowcrop regions except the Pacific West (CA), Northern Plains, and the Pacific Northwest showed increases in appreciation rates (figure 2). Keep in mind, even though farmland appreciation rates are cyclically low compared to the recent Covid year highs and in some cases below 1.0%, anything above a zero-appreciation rate means increasing land values.
Figure #2
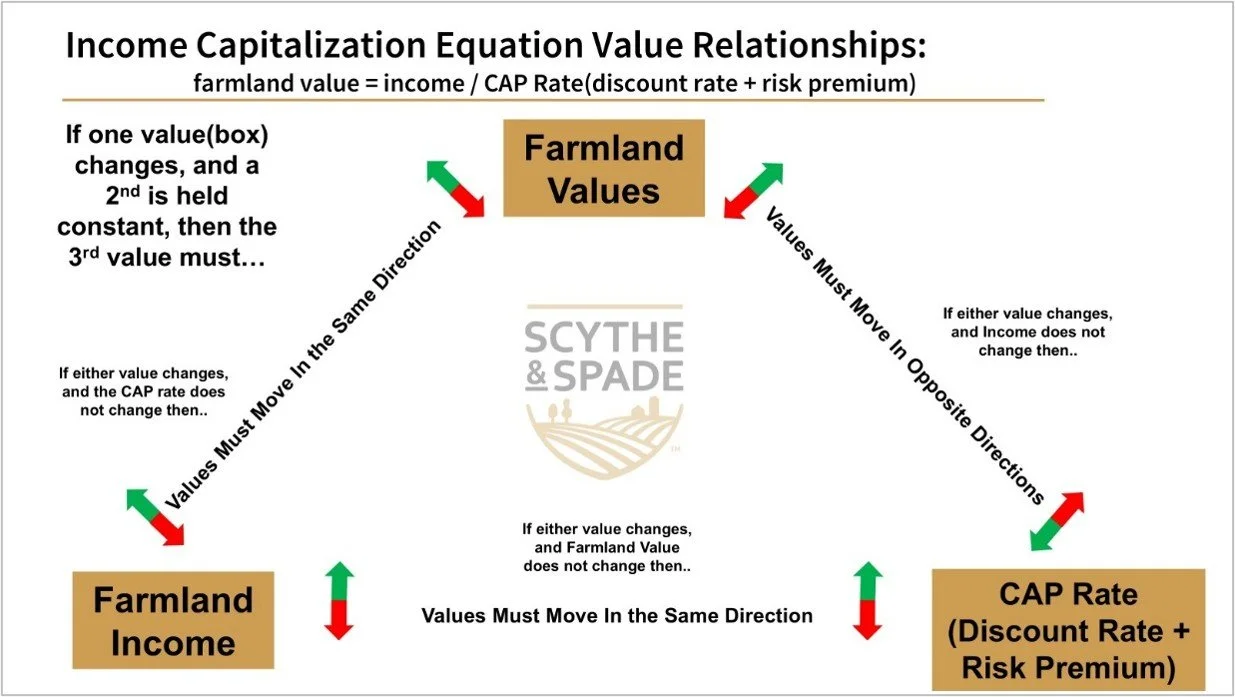
Farmland Values, CAP Rates, and Farmland Income are interdependent variables in calculating farmland investment returns: Farmland Values = Farmland Income / CAP Rate. For the relationship to stay in mathematical balance from one quarter or year to the next, if Farmland Values go up, then either Farmland Income must increase to keep CAP Rates constant, or CAP Rates will decrease if the Farmland Income stays the same or goes down (figure 3).
Figure 3
Of the nine major rowcrop (annuals) production regions tracked in NCREIF, six showed not only land value gains (a positive appreciation rate) for Q3 vs a year earlier, but that rate of appreciation increased vs Q2 (figure 4).
Figure 4
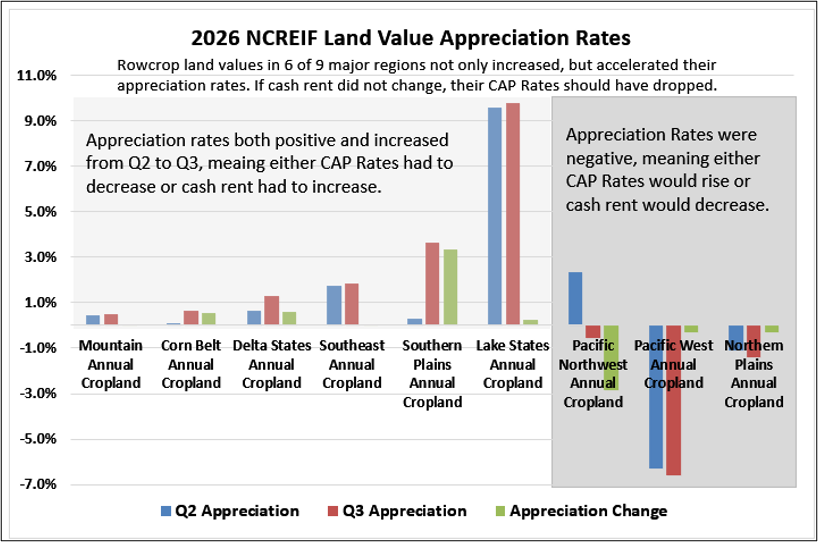
Per figure 2 above, this implies that for CAP rates to at minimum stay the same in these regions, farm income (rent) had to increase.
Additionally, CAP rates went up proportionally more than did land values in all regions except the Northern and Southern Plains, meaning rental rates had to increase more than did the implied rent and CAP Rates from increased land values necessary to hold CAP rates constant at Q2 values (figure 5).
Figure 5
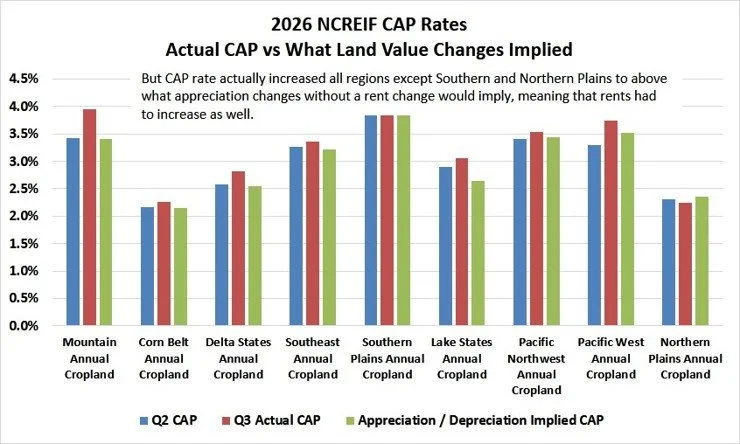
So back to figures 1 and 2 above, CAP rates not only increased in nearly every region in Q3 in conjunction with land values, but doing so means land cash rental rates had to increase proportionally more than land values in those regions.
What gives? Frankly we are skeptical of the results. If accurate, a possible driver might be renegotiated leases in Q3 during the brief spike in commodity values. But this seems unlikely given that possible higher rental rates would not be realized until Q4 2026 or sometime in 2027. Similarly, crop share rent payments from fall harvest could be hitting and adding value, possibly enhanced by the fall commodity price hike. But those gains would have to be realized by the end of September, which is early in many of the regions. Additionally, crop share rental agreements are more common in some regions than others.
Any other theories out there? Are higher government payments being capitalized into rental rates in increasing proportions? Other drivers? Whatever the reason or reasons, it is widespread and, if accurate, challenges traditional farm income and lease rate assumptions. Thoughts and insights are welcome.