2025 NCREIF US Farmland Value Regional Review; Despite Some Regional Losses, the Portfolio Posts Slight Gains
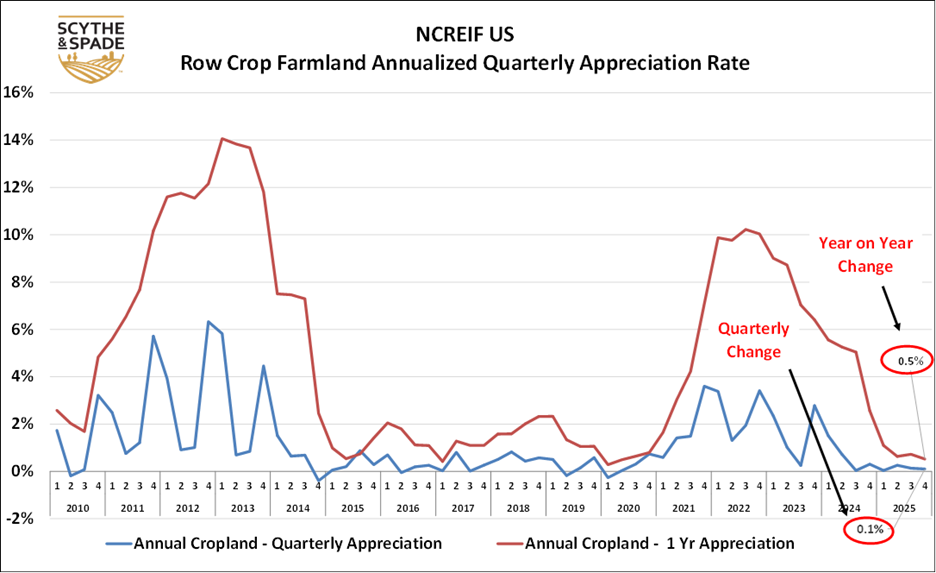
US row crop land values finished the year +0.5% over 2024 with incremental increases in each quarter in 2025. Although individual regions have varied, this continues a record of no decreases in US rowcrop year over year values going back to the start of NCREIF farmland values tracking in 1992. While there have been small individual quarter-over-quarter value decreases, most recently in 2020, year-over-year NCREIF row crop farmland has never shown a loss of value vs the prior year.
DELTA STATES
Delta Q4 row crop farmland values increased +.06% vs the prior quarter, finishing the year at +0.5% vs 2024. NCREIF values in the Delta last recorded a year over year loss in Q3 2017.

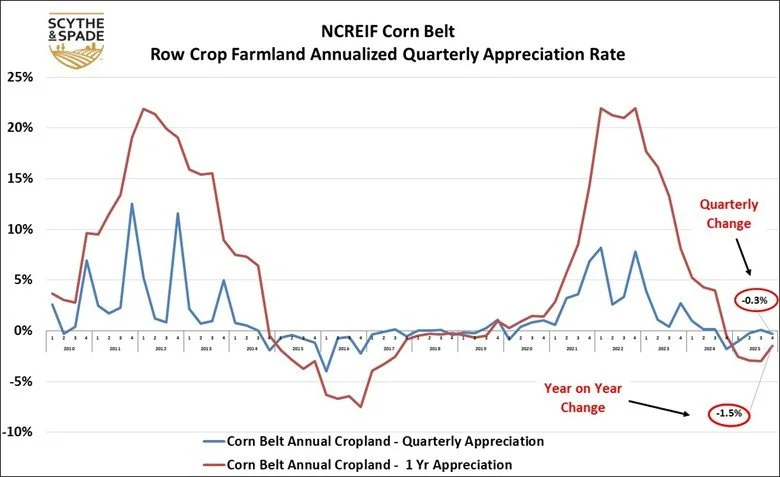
CORN BELT
NCREIF corn belt Q4 land values decreased to -0.3% vs Q3, finishing the year -1.5% vs Q4 2024 value. This is the second consecutive year of value loss in NCREIF corn belt values, having shown a loss of -0.5% in 2024. This appears to be a correction of land values relative to commodity price and cash rent realities after the 2021 and 2022 runup, which saw consecutive gains of 14.3% and 22% respectively.
PACIFIC NORTHWEST
Pacific Northwest NCREIF row crop farmland turned downwards in Q4 2025 at -0.8% vs Q3, but remained positive year on year at +3.5%, the bright spot in regional NCREIF land values. That said, this is a sharp drop vs. a 10.3% gain in 2024.

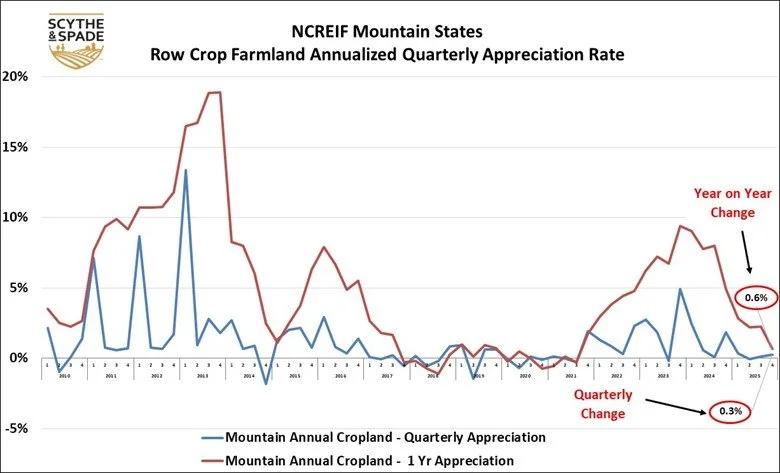
MOUNTAIN STATES
Mountain state row crop land remained positive at +03% vs Q3 and +0.6% for the year, lagging US cropland trips by about three quarters last year.
CALIFORNIA
CA rowcrop land worsened quarter over quarter with a -1.7% value reduction vs Q3. The year-over-year figure was -2.6%, continuing losses for the eleventh consecutive quarter but an improvement vs 2024 at -4.2%. Key drivers for downturn both rowcrop and permanent farmland include long term water supply risk, what parcels are affected, and when to exit.

CA permanent cropland quarter over quarter returns dropped dramatically to -5.9% vs Q3 at -0.1%, finishing the year at -9.6% vs 2024. While this is a significant value loss, it is an improvement over 2024 at -13.8% and we remain optimistic that the corner was turned earlier in 2025 (see red line). Also note we use a slightly different version of the chart here, which includes both a 3 year and 10 year rolling average, both of which are now negative following continuous loss of value since Q4 2019.

SUMMARY
Farmland returns, monitored by NCREIF for its members, continue to provide a more granular insight into investment class farmland than USDA figures alone. Although returns in individual regions, crops, and sub regions can and do vary greatly, once again we see the NCREIF “portfolio” as measured by US rowcrop land, has thus far avoided value loss in the face of a market correction. This tendency combined with its well known features as an inflation hedge with low correlation to stocks will continue to make farmland an integral part of any investor’s portfolio. The space is complex, requiring knowledge of where to invest to hedge against water, climate and geopolitical risks key in developing a quality portfolio with stable long-term returns. Armed with this knowledge, in the current downturn arbitrage opportunities can be found in most of these regions. We’ll be exploring the value of informed portfolios in future posts.