ID Snake River Water Update: Do We Have Enough for 2026?
s we continue to track the volume of water behind the dams in the upper Snake River system it’s apparent that this season we are coming out of lower-than-average water inventories (water stored behind the dams) and a below average snowpack with which to refill the system. How concerned should we be about water availability this season?
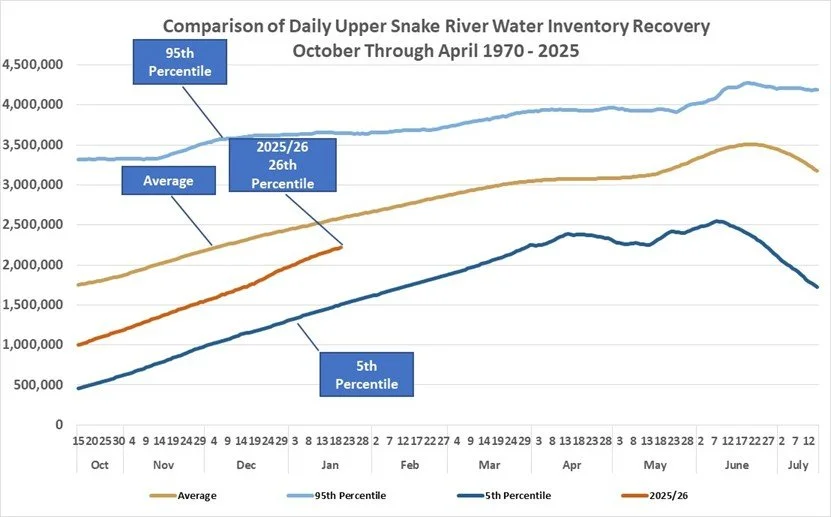
The chart below shows us where that water inventory is to date in acre feet. The gold line is the daily average as we rebuild inventories starting from the end of the previous irrigation season (mid-October) from the 1970 season through 2025. The top light blue line shows the upper 95th percentile across those years. 95% of all years had inventories at or below that line on each date. The lowest dark blue line is the bottom 5th percentile. Only 5% of all years had water levels at or below that line on each date. The red line shows the current inventory through January 21st. Although it has been slowly closing the gap with the average inventory through the winter, it began and is currently at the 26th percentile. Certainly below where we would like to see it, but what does it mean in real terms for this summer’s water availability?
The next chart begins with the previous figures and adds the dotted lines showing the years since 1970 that were within 5% of the current year on the same date. There are six such years, four of which were slightly above the current level on January 21st and two slightly below. As we follow each line through the season we see how the inventories changed through mid-July on the far right. Of our six comparative years, we can see that by mid-July, three years ended above the long-term average, and 3 years ended below the long-term average. The first takeaway is that despite the current water inventory being only at the 26th percentile, the odds of ending the season above or below average levels seem to be 50/50. By this metric we are not yet doomed to have below average water inventories this growing season, but how does annual snowpack play into that?
Beginning from the top on the right in green boxes, we see that the snowpack percent of Mean on January 21st in the three above average years are 127%, 158%, and 90% respectively. The below average years had snowpacks on January 21st of 104%, 94%, and 95% respectively.
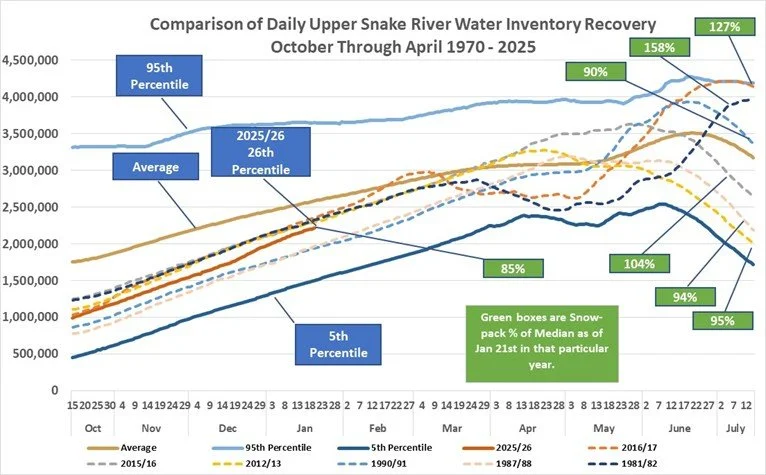
Generally speaking, above average snowpack in January brought about above average water inventories and below average snowpack brought about below average water inventories (who’d a guessed?). But what about those two middle years, with a below average snowpack ending above average and an above average snowpack ending below average? Something happened after January to push them above or below average; later snows, spring rains, we can’t tell from these data sets.
Another pattern we can see is that in general, years ending with above average water inventories began lowering them in late March through early May before rapidly rebuilding them. Years ending with below average water inventories hung on to their supplies through late April, begin decreasing and never regain. This appears to be good management. When snowpacks are high, make room early. When snowpacks are low, hang on to water as long as you can.
The bad news is that our current snowpack of 85% is below any of our similar years going back to 1970. This doesn’t necessarily mean we will end up short of water but hitting average or above seems unlikely at this point.
What does this mean for irrigation in 2026?
The implications of what these findings mean in agricultural returns depends on two additional factors: early spring precipitation and senior water priority. While the exact date of spring groundwork and planting is both crop and regionally specific, you can typically expect most of the state to be pre-irrigating by mid to late April. Well timed early spring precipitation can often postpone the need for early calls of reservoir water, allowing for more time for reservoir recharge and a hopefully longer irrigation season.
Soil saturation rates also play an important role in spring precipitation benefits. Dry or sandy soils with low soil saturation levels will “drink up” not only whatever snow melt we may have but also increase unlined canal and reservoir seepage loss as water is pulled away through the ground before it can reach it’s intended place of use. Both ultimately lower the total water available for the irrigation season.
While the unseasonably higher temperatures in November and December inevitably contributed to the statewide snow “drought”, it did allow the higher-than-average rain precipitation received during that time to sink into the soil[1]. Current soil moisture for the top 8” across the state remains the same and up to 4% higher than last year. If temperatures remain cool, this could lead to positive soil saturation levels during spring runoff and irrigation turn-out in April[2].
Finally, all water availability, regardless of snow levels and precipitation, is dependent on the seniority of each individual water right. Idaho’s water laws clearly outline that those with the oldest recorded claims to a water source, must be provided their full share of that water prior to any others with claims staked later for that same water source. If we do end up in a short water year, those with younger water rights could face greater injury to their crop yields due to water curtailments on their rights than more senior right holders.
When faced with a short water year, understanding your water right seniority and soil type of each field is imperative to crafting a water-wise crop plan. These years are also a great reminder to look into how investments into water saving/efficiency technologies and practices can reduce drought-related risks and increase the overall value of the farm.
[1] USDA NRCS Air & Water Database Report
[2] Soil Moisture National Weather Service Soil Moisture Forecast and Reporting