A Deep Dive into The U. S. Hazelnut Market
By Rosalie Hagglund
Due Diligence is at the core of what we do at Scythe & Spade. Recently we were engaged to represent a seller on a large hazelnut orchard in the Pacific Northwest. As we began our due diligence on the orchards, it quickly became apparent that we would need to also examine the industry itself. Between battling a fragmented market, Eastern Filbert Blight, Chinese tariffs, depressed prices, and skyrocketing input costs, U.S. Hazelnut growers have faced a few difficult years. One of our brand promises is to “Do the Due Diligence that is Due.” This extends to every facet of a transaction, including an analysis of the market for crops grown on properties that we are conducting due diligence on.
Join us as we take a three-part look at what we have learned about the hazelnut industry. In Part 1, we will explore the U. S. Hazelnut Market and look to answer the following questions.
· What is the U.S. share of global hazelnut production?
· How has U.S. domestic consumption changed over time?
· Have prices kept up with inflation?
· Who are the U.S.’s top hazelnut trade partners?
· How have we adapted to the pressures of Chinese tariffs and massive increases in shipping container costs?
· Where is the U. S. Hazelnut market heading?
· What can investors and growers do to give themselves a leg-up?
We will be using a 25-year history, U. S. Dollars, Acres, Metric Tons converted to In-Shell BASIS, and unless, otherwise stated, we will be using the hazelnut marketing year which runs July-June.
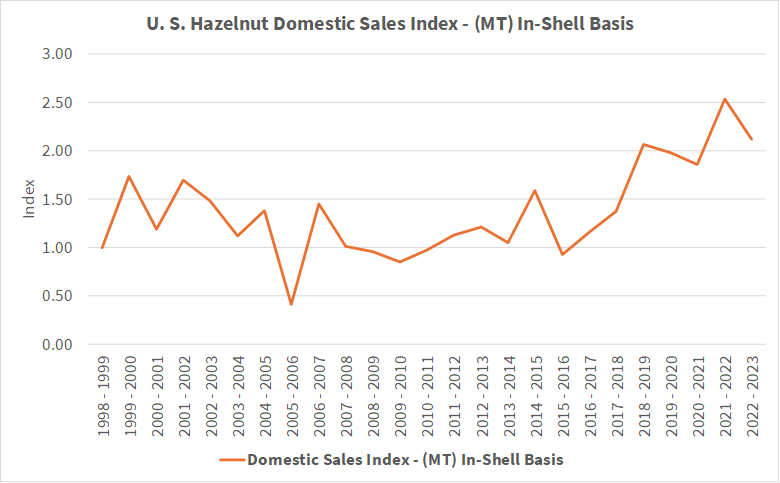
Domestic Sales
After remaining relatively flat for many years domestic sales by volume have risen 212% since 2015 / 2016, showing continued trendline growth in domestic demand.
Market Terminal hazelnut prices have risen 225% in the past 25 years. Using the U. S. Bureau of Labor Statistics CPI inflation calculator[1], inflation has risen 182% from January 1999 to January 2023. Although prices have been relatively flat since 2020 / 2021, on balance hazelnut prices have outpaced inflation by 43%.

World share
Although the U.S. has been one of the top five producers of hazelnuts for over 25 years, it only produces between 4-6% of the world’s hazelnuts. 99% of U. S. Hazelnuts are produced in the Oregon Willamette Valley.

Imports vs Exports
25 Years ago, imports made up 49.35% of the available hazelnuts in the U. S. The 2022-2023 USDA (United States Department of Agriculture) data[2] has that number down to just 8.94%. This took us from being a net importer of hazelnuts to a net exporter of hazelnuts in 2003 / 2004, meaning we were no longer reliant on other countries’ production to meet our increasing demand.. The chart below shows the U. S. Hazelnut imports and exports as a percentage of U. S. Hazelnut sales.

Exports
According to USDA FAS GATS (Global Agricultural Trade System) data,[3] combined exports of in shell and shelled hazelnuts by Volume (converted to in-shell basis) have risen 364% in the past 25 years and our exports by Value have risen 728% in that same time. International demand for premium, quality U.S. grown hazelnuts has increased, once again outpacing inflation. In a September 2023 letter to Hazelnut Growers Bargaining Association members, Executive Director Terry Ross stated that Oregon processors have “consistently beaten the commodity/world price of hazelnuts by 10%, 15%, or even 20%.” Our follow up article will go into depth as to where the U. S. stacks up in the global hazelnut market.
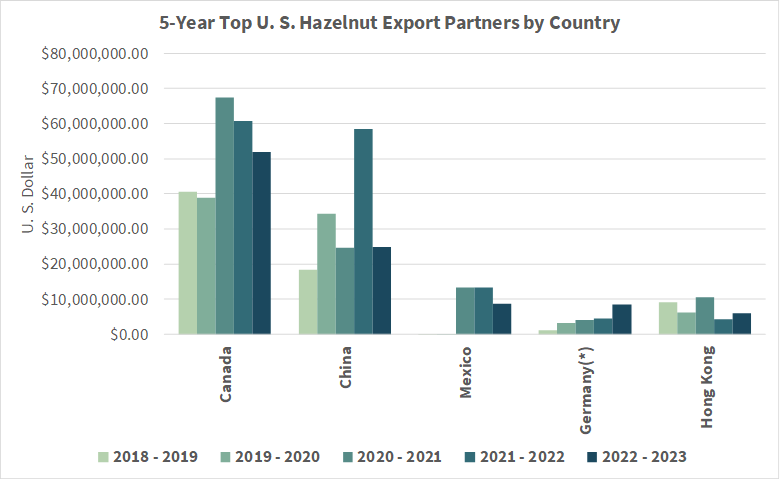
Historically, China has been the ultimate consumer of U. S. Hazelnuts but that is no longer the case. For the past five years, Canada has consistently been the largest purchaser of U.S. Hazelnuts by value. In fact, the five-year gross U. S. Hazelnut sales to Canada have surpassed the five-year gross U. S. Hazelnut sales to China, Hong Kong, Mexico, and Germany COMBINED. U. S. Hazelnut sales to Canada has grown by over 2,510% in the past 25 years and our Hazelnut sales to Mexico have grown by over 1,659% in that same time. This is a good indicator that the U. S. hazelnut market is adapting well to the pressure from high tariffs and increased costs of shipping abroad.
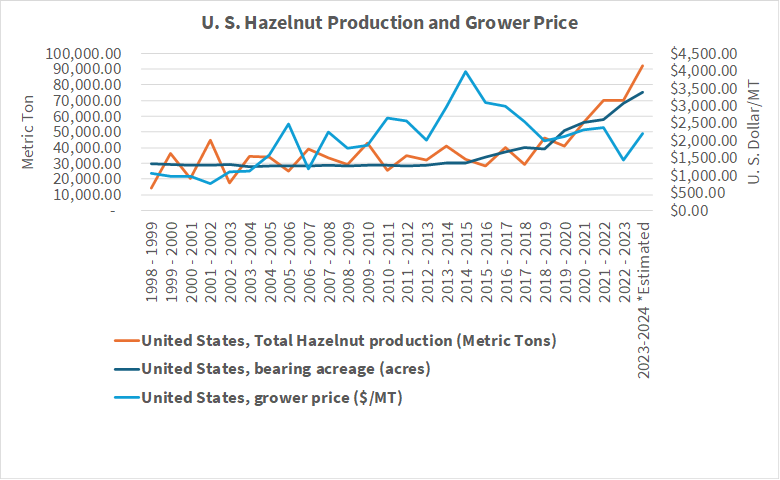
Production and Grower Pricing
According to the USDA, U.S. Hazelnut production has increased 538% over the past 25 years, from 14,061.36 MT in 1998-1999 to 70,306.81 MT in 2022-2023. The period from 2010-2017 saw strong pricing for growers which, combined with the release of new blight-resistant tree varieties, caused new hazelnut plantings to surge. The downward price pressure from this rapid expansion was severely felt by growers once these new plantings hit production in 2021 and 2022. The initial 2023 guaranteed minimum price from the Hazelnut Bargaining Association once again looked bleak, but poor production in Turkey and Italy helped boost U.S. prices. Bonuses were announced in January 2024, almost doubling the initial guaranteed price. The final 2023 field price has yet to be released as of the writing of this article.[4]
Sustainability and Alternative Uses
According to the USDA’s Climate Hub website, hazelnuts are a climate resilient crop and that many environmental benefits, including carbon storage. The USDA also states that data shows that hazelnuts could potentially be a bioenergy source, producing nearly two times as much oil per acre as soybeans[5].
Where is the U.S. Hazelnut market headed?
Historically the U. S. Hazelnut market has been a predominantly in-shell market. However, the planting of new varieties has allowed growers to pivot to meet the increasing demand in the kernel market. As seen in the chart below, the total value of U. S. Hazelnut kernel exports has sharply increased over the past 3 years and in 2021-2022 they surpassed In-Shell Exports. This is good news for U. S. Producers in that shelled products represent a value-add capture relative to in-shell products.

As the U. S. Hazelnut market adapts to the kernel market, older and smaller processors are getting pushed out, unable to outlay the needed capital to convert to shelling and developing kernel customers. On March 1st, 2024, Firestone Processing Co. in the Willamette valley in Oregon, announced the closure of their hazelnut processing facility citing these exact reasons. As painful as it is to lose these pillars of the hazelnut industry, it will allow for more consolidation in the hazelnut processing industry, which can lead to a less fragmented market. Which in turn, could lead to strengthening of prices for growers.
What Does This Mean for The Orchard Owner?
In the previous sections we studied the U. S. Hazelnut market and how it relates to the grower. But what does this mean for the orchard owner? For the investor? The National Counsel of Real Estate Investment Fiduciaries (NCREIF) data shows drastic volatility from about 1998 through 2014 for permanent cropland in the Pacific Northwest in both the CAP rate and Appreciation rate. While we are not seeing the same 20+% CAP rates or the 13% Appreciation as we did during that time, we are seeing a much more stable and consistent growth pattern.

Hazelnut leases are often long-term leases on a crop share basis. This can lead to unpredictable income for the landowner, but it incentivizes the grower to maintain good orchard stewardship, which maximizes the landowner’s investment. According to Oregon State University’s 2022 Hazelnut Enterprise Budget,[6] the cash cost of establishing a double-density hazelnut orchard (non-irrigated) and bringing it to full production (11 years) is $14,670/acre. They figure the economic cost at $41,304/acre. With this substantial investment, the quality of the tenant is vital.
The same OSU budget states, “Economic theory suggests that dollars be invested if marginal revenues exceed marginal costs. A few examples would be investing in the following if the producer applies the profit maximization theory: 1. Higher quality nursery stock. 2. Additional detailed pruning. 3. Irrigation systems, as long as the profit maximization theory is met. As the adage goes, sometimes it takes money to make money!” I believe an additional basic economic principle can be applied here. Economies of scale. Hazelnut orchards in the Willamette Valley are typically 30-100 acres, making it difficult for growers and landowners alike to maximize profits.
In Scythe & Spades due diligence of a recent project, we found that the property we are representing capitalizes on both these principles. From using quality nursery stock, to installing a comprehensive irrigation/fertigation set-up, to gravel roads to handle the Oregon rain, these investors spared no expense in developing this orchard. It consists of 1,038 acres of 5–7 year-old hazelnut trees, providing a rare opportunity to purchase over 1% of the U. S. Hazelnut producing acres just as they are coming into full-production.
Stay tuned for Part 2 where we will look at the global hazelnut market.
[1] CPI Inflation Calculator (bls.gov)
[2] CPI Inflation Calculator (bls.gov)
[3] FAS - Global Agricultural Trade System (GATS) (usda.gov)
[4] Members — Hazelnut Growers Bargaining Assoc. (hazelnutbargaining.com)
[5] Climate-Resilient Hazelnuts in Oregon and Washington | USDA Climate Hubs