Idaho’s Current Irrigation Water Supply; A Deep Dive Into the Numbers | Part I
Idaho, along with the Pacific Northwest and most western states are currently suffering from drought. In an effort at Scythe & Spade to put the current severity of the drought in context, as well as understand the current and future implications of irrigation water availability on a district-by-district basis, we have begun a deep dive into a very rich historical data sets. This is a first look at data aggregated from four different government agencies and resources as it applies to the upper Snake River water basin. The same methodology can be applied virtually any basin or district within the Pacific Northwest or other western states.
What the data currently tells us:
Water inventories have been above the long-term average for the previous five years.
Although the upper Snake River basin is currently in a drought and last winter’s snowpack was light, the current water inventory remains above a long-term average, beginning with the year 1957 running through early July 2021. We should, however, expect the current inventory to be drawn down significantly by late September.
Recent water inventories and patterns in this basin do not appear to be significantly different than those over the previous 60 and perhaps 80 years.
Historic Upper Snake River Water Inventory
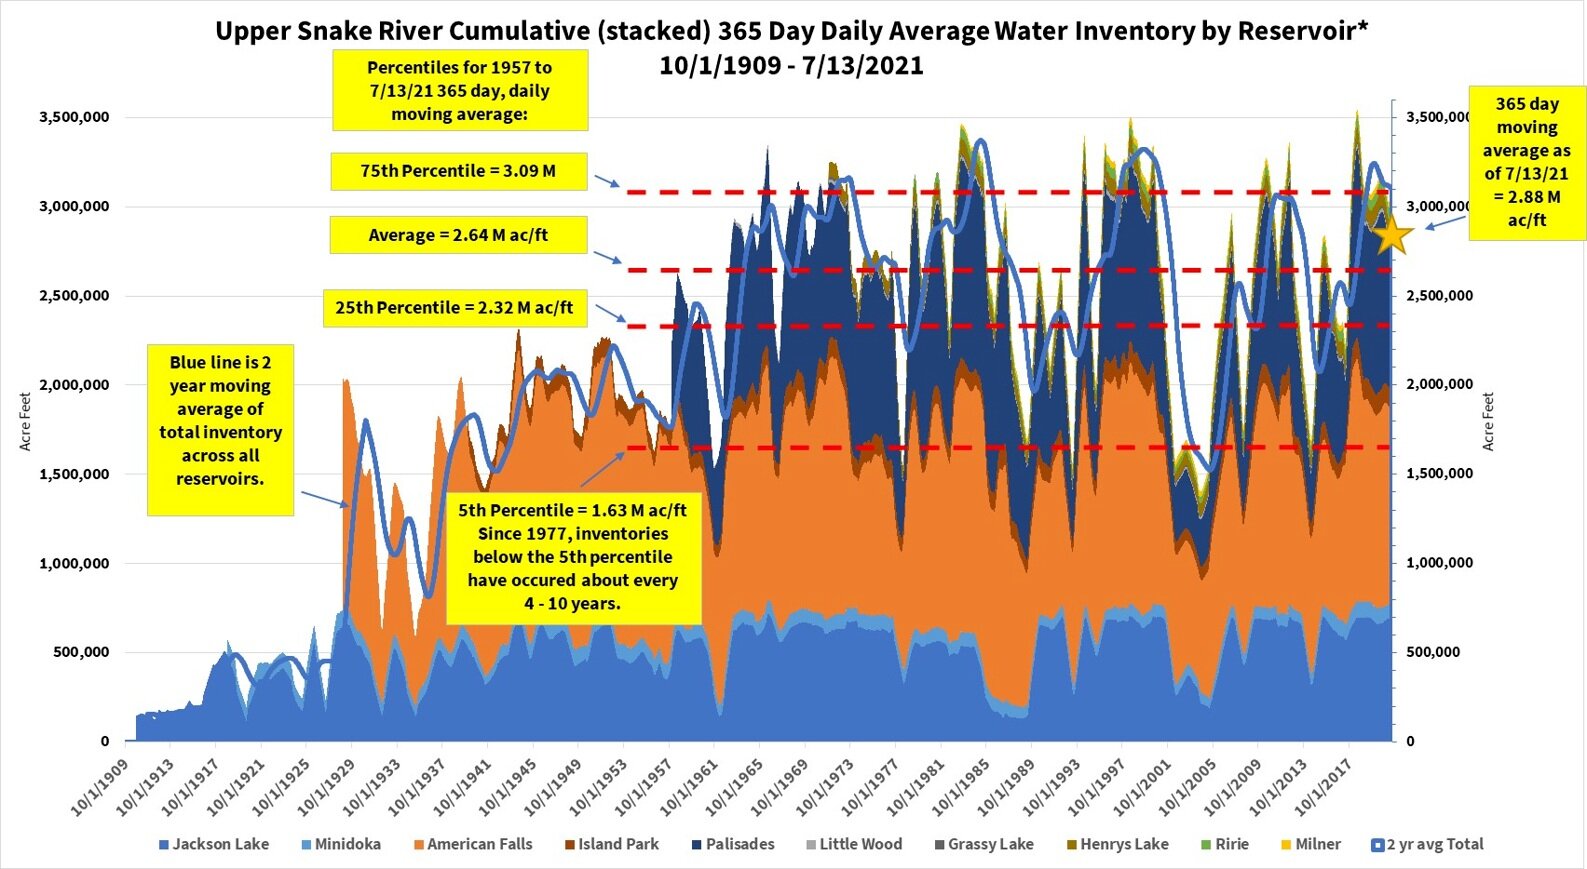
The following chart and accompanying statistics are derived from historical daily water inventories from each of the ten dams on the upper snake river dating back to 1909. In most cases, the figures go back to when the dam originally went online.
Upper Snake River Water Inventory
Source: https://www.usbr.gov/pn/hydromet/burtea.html, accessed July 20, 2021.
The stacked bar chart shows the daily 365 day moving average (for any given day, the average of that day and the previous 364) of the daily water inventory for each dam, stacked on top of one another to show the total water inventory of the upper snake river at that time. A 365-day moving average was used to visually “smooth” the data and make patterns more apparent. The solid blue line represents a two-year moving average of the total inventory for further smoothing and to help distinguish long term vs short term patterns.
Additional Observations:
Inventories at and below the historical lower 25th percentile occur approximately every 4 – 12 years. As of July the basin as a whole remained in the historical upper 50th percentile.
Water inventories in this basin are volatile over the long term; we can expect about 5% of the daily rolling average inventories to be as low as 47% of peak figures and 62% of the long-term average.
There is a great deal of water inventory variation between each of the ten reservoirs in the basin, potentially impacting individual water districts differently. Our next post will take a closer look at the individual reservoirs.
What the data does not tell us (so far):
Although we have not experienced inventories in the lower 25th percentile since 2014, it is too early to confirm whether those low levels will occur this year or how long they would last. Much will depend on the coming winter.
When water inventories are low, what amount of water is available for surface irrigation and when could water availability be significantly curtailed?
Although the data gives an indication of how long short water supplies might last (1-5 years), it does not tell us how long it will last.
Wrapping it Up:
Scythe & Spade will continue to study these data sources to shed light on additional water basins. This has the potential of guiding investors, including:
Other river basins, such as western Idaho, the Pacific Northwest, and California.
Long term water supply risks and volatility for individual water basins, districts and thus farms.